Keysoft BI - Business Intelligence
The raw data entered into the system is transformed into useful information
Information structured in graphs and reports
The current activity of a company generates a huge amount of data that should be the basis of business decisions.
Unstructured, these data represent only whole volumes of historical data whose processing, by classical means, requires an often unjustified workload.
KeySoft BI provides structured and immediately available information from data managed by the component modules of KeySoft TMS .
The raw data entered into the system is transformed into useful information represented both in the form of reports and in the form of graphs with multiple filtering options.

Drill down
Multiple drill down options allow you to adjust how graphs, reports, or indicators are displayed from global to private.
- Manufacturer, product group, product line or products;
- Client portfolio, type of client or client;
- Period;
- Top customers, top products;
- Top increases / decreases;
- Sales agent;
- Value, margin or quantity;
- Location, etc.
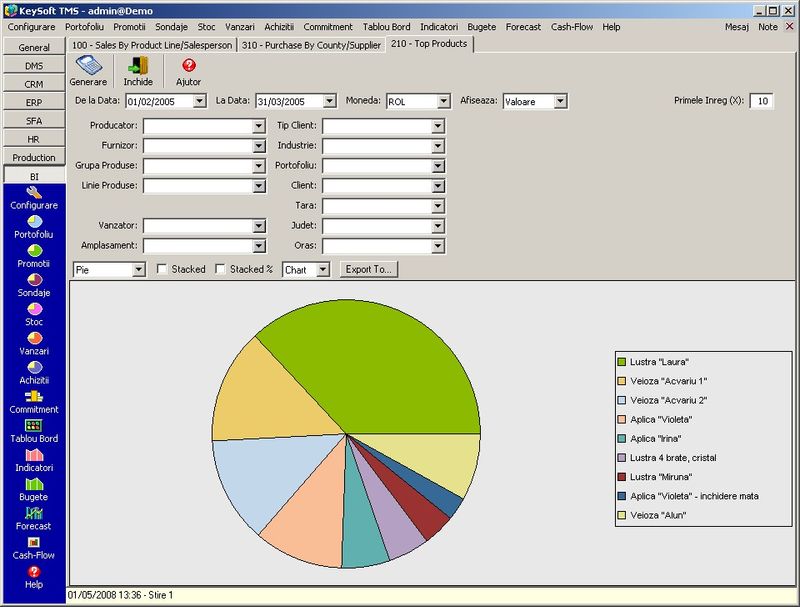
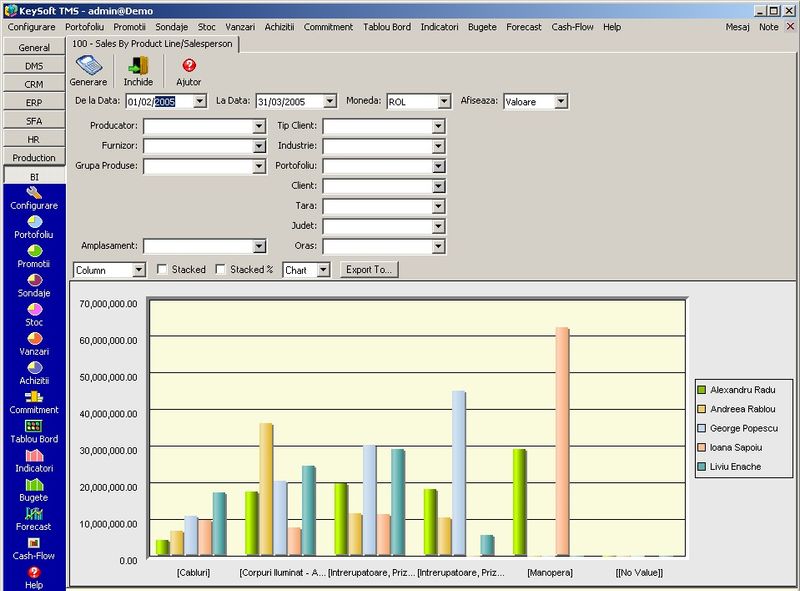
Sales charts and reports
Set of 67 graphics with multiple filtering possibilities (by value, volume or margin; by a sales agent, in a certain location, by area, etc.) that provides all the available information resulting from the sales process. Example:
- Top "n" products
- Top growth;
- Top decreases;
- Consolidated sales during the period;
- Top customers (value, volume, margin) by period;
- Sales by region during the period;
- Top sales agents, etc.
Budgets - Planning and tracking
A simple tool is available for defining budgets - for any period of time, monthly, half-yearly or annually. Budget execution data is extracted by the application from the accounting data.
A comparative display (tabular and graphical) of the values obtained in relation to the estimated ones is available at any time.
The budget can be defined in any currency, and the comparison will be made by converting currency to historical exchange rate. Information on the corresponding budget situation can be made available to each department head (cost center, etc.).
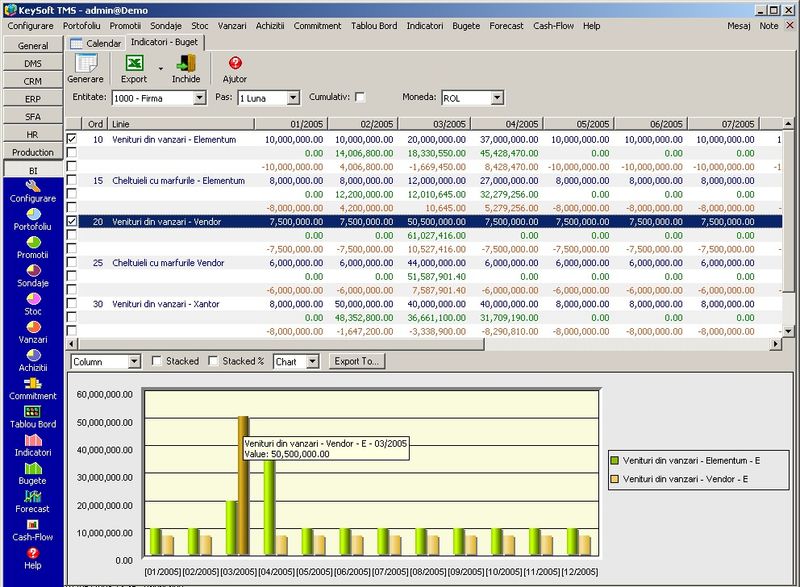
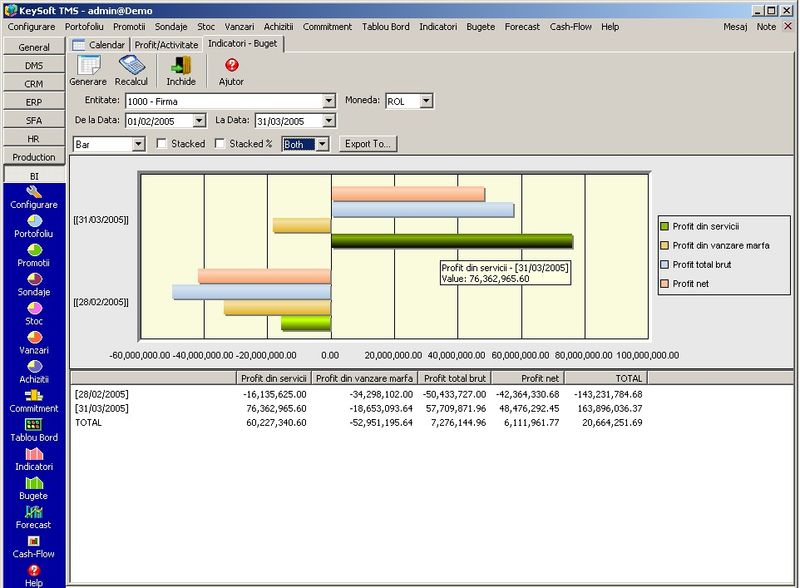
Economic and financial indicators
Built through an extremely friendly graphical interface, the economic-financial indicators provide information based on the data found in accounting accounts (turnovers, balances).
A simple operations builder can be used by any user of the application (based on access rights) to define economic and financial indicators. Everything is done by selecting accounting accounts and defining transactions between their values. The application will automatically generate evolution reports and graphs based on your definitions.
You can define an unlimited number of financial indicators that provide overview of the situation / evolution of the company as well as specific indicators that address only certain areas of activity (example: sales, payroll).
Having the possibility to segment the business into multiple component elements (cost centers, projects, locations, etc.) the economic-financial indicators can reflect the situation / evolution of each defined segment.
In addition, you can predefine reports that meet the corporate information requirements.
Through the access rights system, each of the managers can have immediate access to information that allows them to make timely decisions to improve results. At any time, based on the information regarding the company's activity, the system will calculate each component of the indicator, which will be presented both in tabular and graphical form; the evolution over time of the respective indicator is also presented.
Inventory charts and reports
Set of 32 graphics with multiple filtering possibilities that provide all the centralized information about the existing inventory.
Acquisition charts and reports
Set of 60 graphs with multiple filtering possibilities that provide all the available information resulting from the purchasing process.
Commitments
Often, in the commercial activity of distribution companies, there are agreements clearly stipulated in the commercial contracts regarding the volume of purchases and / or sales based on which different commercial conditions are established (preferential prices, discounts, rebates, prizes, etc. …).
Using these reports, it will be known at any time what is the status of purchases or sales (staggered monthly) on a certain group or product line and it will be possible to make well-reasoned decisions.
Portfolio charts and reports
Set of 22 portfolio reports that allow quick viewing of the portfolio structure of partner companies, per manager (account manager), industry, location, status, type, etc ..
Forecast
Forecasting tries to predict the behavior of processes / variables based on past data, thus becoming a key element in business planning (most business decisions are based, to some extent, on forecasting).
The most important forecast reports in business are: Future Product Demand and Future Product Prices.
The application offers you several forecasting methods so that you can choose according to the specific activity. The setting of the forecast method can be done per product line or, specifically for each product (in which case the application will ignore the setting from the product line). Adjusting sales forecasts can also be done manually.
The resulting data are displayed both graphically and tabularly. The general theory recommends the existence of a consistent history, at least 2 years, for the forecast calculation.
Cashflow
Starting from the current situation (currently available in cashiers, banks), all the primary documents that may affect the financial availabilities are taken into account:
- Sales invoices;
- Purchase invoices;
- Approved sales orders (optional);
- Approved purchase orders (optional);
- Other operations that do not have a supporting document (for example - payment of salaries).
In addition, the application allows the definition and registration of any possible transactions with potential effect on availability, transactions that can be single or repetitive. These transactions, by their nature, are not found in primary documents. Examples: salary payments, bank installments and interest payments, potential proceeds from the sale of unused assets, etc.
The application offers information in both graphical and tabular form, with the possibility of following the evolution of availability both consolidated and at the level of bank account (cashier). The tabular information can be transferred, with a single click, in Microsoft Excel, thus offering complete freedom in modeling any situation.
Standard features of KeySoft ERP allows you to adjust your cash flow:
- Estimating the time required for the money to reach the account (delays in banks);
- "Payment approval" assigned to purchase invoices;
- Modification of the estimated date for collection / payment;
- Reallocation of receipts / payments to other bank accounts, etc.


Integrated Software - Total Management System
Starting with inventory management and business accounting (ERP), KeySoft TMS coordinates human resources (HR) and customer relationship management (CRM) through business processes organized and tracked by the document and internal flow management solution (DMS). ), converting raw data into information in the form of graphs and reports (BI).